Study 1
Country-level data
Countries were not affected in the same way by COVID-19. Some countries reported close to zero deaths, while others already counted tens of thousands. Why such differences between countries?
For each country, we had collected the following data:
- Number of inhabitants
- Population density
- Wealth per inhabitant
- Average life span (from 52 years in Angola to 84 in Japan)
- Average age (from 16 years in Chad to 43 in Italy and Japan)
- Quality of the health system
- Press freedom (from 0 in North Korea to 77 in Sweden)
- Average April temperature in the country's largest city
- Declared COVID-19 deaths per million inhabitants, April and May
Here is the correlation matrix. As a reminder, correlation coefficients range from -1 to +1: +1 is a perfect positive correlation, -1 a perfect negative correlation, and 0 means no linear correlation.

Four features were highly correlated with one another: wealth per inhabitant, average life span, average age, and quality of the health system. In a prosperous country, people tend to live longer, the average age is higher, and the health system tends to be better.
The declared death rate per million inhabitants was strongly correlated with those four features. That might sound contradictory, but it was a side effect: a better health care system meant a longer life span and an older population, which in turn meant a higher COVID-19 death toll.
Press freedom and the declared death rate were positively correlated: the less press freedom, the lower the declared death rate — suggesting the true toll was understated in some countries.
Temperature was negatively correlated with wealth per inhabitant (poorer countries tended to be hotter) and with the declared death rate. But an effect is correlated with its cause, and two effects will also be correlated with each other: did higher temperatures reduce deaths, or were there simply fewer deaths in hot countries because they tended to be poorer, with a younger population and a lower life expectancy? The correlation matrix alone could not answer that.
We took the analysis further by training a gradient boosting algorithm — widely considered one of the most reliable machine learning methods, and capable of picking up correlations even when they are not linear — on our dataset.
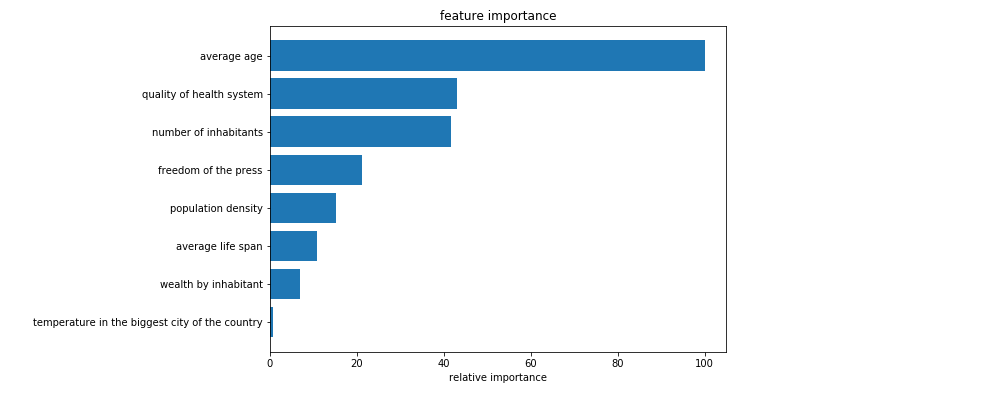
Conclusion: temperature had no significant impact on how the pandemic evolved.
COVID-19 data: jhu.edu
Press freedom: rsf.org/fr/classement
Health system quality: april-international.com
Average life span: wikipedia.org — life expectancy
Average age, by country: wikipedia.org — median age
Wealth per inhabitant: wikipedia.org — GDP (PPP) per capita
Population density: wikipedia.org — population density
Population: wikipedia.org — population
Temperature, April 2020: tutiempo.net